Description
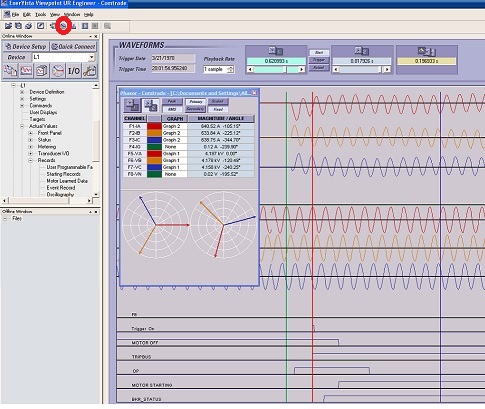
Oscillography and phasor diagram are two powerful tools to troubleshoot power issue in GE Viewpoint UR Engineering. After you load an oscillography, you can click on the Phasor button (circled in red in the picture below) to turn on the phasor diagram. There is a green line, which ties to the phasor diagram with the button with label 1 (upper left corner at the new phasor window). The blue line at the right ties to the phasor diagram with the button labeled 2 (second button at the upper left corner at the new phasor window, which is selected in the picture). When the blue line is moved in the picture, phasor diagrams display values at that instance. With these sliding lines, one can examine values at different time, which is valuable in troubleshooting.